Oceans Overview
The oceans play a key role in the variability of our climate. Although the sun is the engine that ultimately drives the weather on earth, the oceans and atmosphere channel the sun's energy locally to produce regional climates. There is only one ocean, one body of water. We humans take the liberty of calling the five different sections of this body of water (Atlantic, Pacific, Indian, Arctic, and Southern) by various names so we can associate an area by its location. But there is only one continuous body of water.
The area of the "world ocean" is 361 million square kilometers (139 million square miles) and its volume is approximately 1.3 billion cubic kilometers (310 million cubic miles). Its average depth is 3,790 meters (12,430 ft.), and its maximum depth is 11.0 kilometers (6.8 miles). Nearly half of the world's ocean waters are over 3,000 meters (9,800 ft.) deep, The vast expanses of deep ocean (anything below 200 meters (660 ft.) cover about 66% of the Earth's surface. The bluish color of water is a composite primarily of organic matter and chlorophyll. The oceans cover 71% of the earth's surface and compose 97% of the water on earth (only 3% is fresh water). The deepest point in the ocean is the Marianas Trench, located in the Pacific Ocean near the Northern Mariana Islands. Its depth has been estimated to be 35,994 feet (10,970 meters).
This great ocean reservoir continuously exchanges heat, moisture, and carbon with the atmosphere contributing to the slow, subtle changes in our climate. The ocean's climatic role is critical because of its ability to absorb, store, and transport heat from the sun. When the air is at a lower temperature than seawater, the ocean transfers heat to the lower atmosphere, which becomes less dense as the heat causes molecules in the air above to move farther apart. A low-pressure air mass then forms over that part of the ocean. On the other hand, cool waters lead to the formation of high-pressure air masses as air molecules compact and move closer together. Because air always flows from high-pressure areas to low-pressure areas, winds form and flow towards the low-pressure areas.
Evaporation from the surface of our oceans is important in the movement of heat in the climate system. Water evaporates from the surface of the ocean in warm, cloud free subtropical areas near the equator. This cools the surface of the ocean. Water vapor carried by the atmosphere then condenses as clouds and falls as rain far from where it evaporated, Condensing water vapor releases heat and this heat drives atmospheric circulation. The atmosphere transports water from the oceans over land. This fresh water supply allows life as we know it to exist on land. Evaporation from land areas back into the atmosphere returns the fresh water from the land back into the oceans. 78% of global precipitation occurs over oceans. Rivers, streams, and melting ice also return fresh water to the oceans, thus completing the cycle. Top
Sea Levels Have Had Huge Swings In The Past
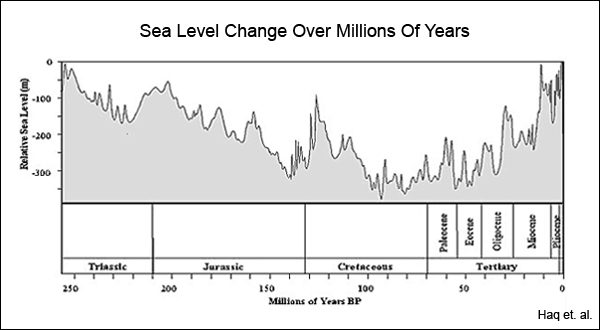
As can be seen at the chart at the left, sea levels have changed by huge amounts over the past 250 million years. This now famous "sea level curve" was put together by Peter Vail/Bilal Haq and associates. It shows that at one point 90 million years ago, the seas were about 1,300 feet (400 meters) below today's levels. Smaller swings of 165 feet (50 meters) were very common. There have been over 100 global cycle swings in sea levels. More recently since the last glacial period (ice age) about 20,000 years ago, seas have risen 120 meters or about 400 feet. Our seas now appear to be near record high levels. About 120,000 years ago, the seas were slightly higher than they are today by about 20 feet as recorded on wave notched cliffs in the Bahamas. How was this remarkable chart generated?
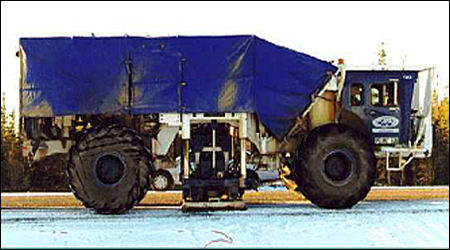
Back in 1977 a team of Exxon geologists from Esso Research headed by Peter Vail published the original global sea level change curve using a technique called seismic (earth shaking) stratigraphy (striating - the study of rock strata). Deep seismic vibrations (reflectors), like those produced by the truck shown at the left, are reflected off underground formations and recorded back at the surface and subsequently analyzed. The trucks have a plate that is lowered to the ground and supports it while the truck vibrates and shakes the earth below. This technique can be used to observe underground formations as much as 50 kilometers (30 miles) below the surface. The technique, using high resolution equipment, has become standard practice in the exploration industry because it is cheaper than drilling cores. The original 1977 Vail sea level data was subsequently revisited in 1988 by Bilal Haq and is now the standard used to date strata as recorded in new exploration. Top
Recent Sea Level Rises Have Been Modest, But Are Accelerating
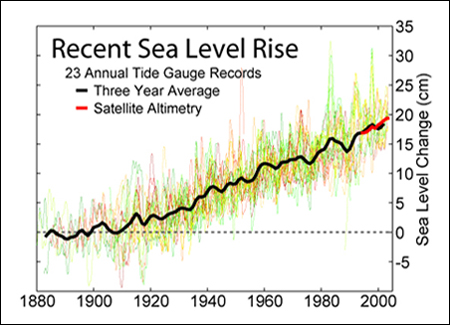
From data accumulated over the last 100 years from 23 tide gauges averaged around the world (black line shown at the left) we can see that global sea levels rose by 19 cm (7.5 inches). Using more modern GPS satellite measurements, Woppelmann et al. determined that the oceans were rising at a global rate of 1.61 ± 0.19 millimeters per year over the past century with no recent acceleration. This translates to 6.3 inches over the last 100 years. Sea level increases are 60% from thermal expansion of the ocean water and 40% from melting ice.
If average global temperatures were to rise 3°C (5.4°F) we can expect sea levels on average to rise about three feet by the year 2100. This would be about 5 times the rise of the last century. Ice is melting worldwide especially at the poles. Melting includes some high inland mountain glaciers, ice sheets covering West Antarctica and Greenland, plus some Arctic sea ice. See the Polar Ice Page. However it would take thousands of years to completely melt all the ice.
The glaciers and ice sheets are melting mainly around the edges. With a 3°C (5.4°F) temperature rise, there will be damage to some low lying areas such as bayous, swamp lands and some low islands. However, remember that hurricanes and other storms often produce ocean surges that are 10 or more feet high. (Katrina in 2005 produced a record surge that was 25 feet high.) Some barriers might have to be erected or elevated around some US cities like New Orleans, Miami, and probably New York City. Low lying countries like Bangladesh (one of the world's poorest countries) will be much harder hit and a three foot sea rise would reduce its rice farming land by about 50 percent and displace millions of people. Unfortunately, there is probably nothing mankind can do about rising seas in general. The only question is: By 2100 is it going to be a 2 feet or 4 feet rise? The answer depends upon how the world responds to increasing carbon dioxide and other pollutants accelerating global warming. See the Rising Seas Page. Top
Oceans Have Been Heating Up Too
The earth's energy balance is the difference between the amount of solar energy absorbed by the earth and the amount of energy the planet radiates back to space. If the balance is positive, more energy is coming in than going out, we can expect the earth to warm; and if the balance is negative, we can expect the earth to cool. Ocean temperature data is critical in calculating the energy balance as 93% of the energy from the sun is stored in the oceans before eventually being radiated back into space.
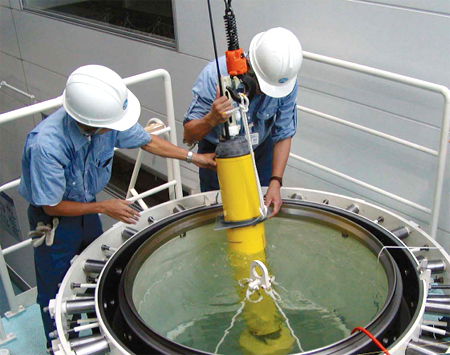
An international array of "Argo" floats that measure ocean heat content to a depth of 2000 meters was completed during the past decade. Twenty three countries contributed to the Argo flotilla. See the picture of one of these floats at the left. These floats replaced an unreliable much smaller fleet of "XBT" floats.
Initially floats were designed to measure under surface ocean currents, but then were modified to also record temperature and salinity. The Argo floats operate on a 10 day cycle. The floats initially spend 10 hours at the surface and then descent to 1000 meters. They remain at 1000 meters for 8 to 10 days measuring the
velocity and direction of currents. Then they descent to 2000 meters profiling the temperatures and salinity along the way. Finally they ascent to the surface and send their recorded information to a Jason satellite.
This information is then compiled by two Argo Information Centers (AICs), one in the US and the other in France. The data is shared by all participating countries and made available to interested ocean scientists all over the world. Argo floats were first deployed in late 1999 and the deployment was completed in 2007. Over 3,400 Argo floats have been deployed around the globe and especially in the southern oceans never before measured. The floats are spaced every 3° throughout the ice free areas of the oceans.
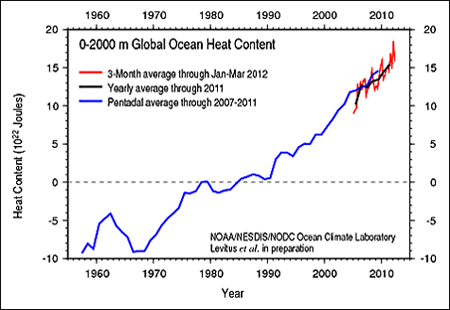
These floats have allowed climatologists to make a very accurate measurement of the earth's energy balance. During the 6 year period from the beginning of 2005 through 2010, the upper 2,000 meters of the world's oceans gained energy at a rate +0.41 w/m2
averaged over the planet. See the NOAA chart above. James Hansen and team at NASA's Goddard Institute for Space Studies (GISS) used this and other data to estimate the total energy absorbed by the upper oceans, the deep oceans, all surface land and ice sheets. GISS calculated that the total earth's balance (actually an imbalance) of energy was an absorption of +0.58±0.15 w/m2 during this 6 year period. Top
Can Ocean Surface Waters Be Cooling While Deep Water Is Heating?
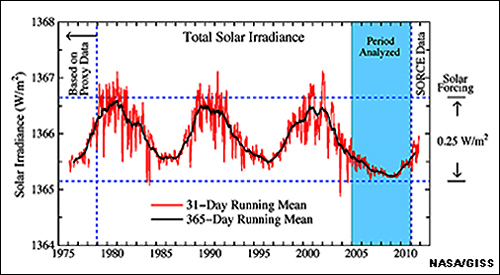
At the end of Sunspot Cycle 23, about the end of 2004, the sun went through an unusually long cooling period before beginning Cycle 24 as shown in the graph at the left. This cooling period was two years longer than normal and the longest in recent history. See Sunspot Cycle 24. According to Hansen et al. from the NASA Goddard Institute for Space Studies (GISS) the fact that the earth gained energy at a rate 0.58 w/m2 during a prolonged solar minimum suggests that there is a source of heat (greenhouse gases) overwhelming the cooling effect of the below average solar irradiance. This suggests that CO2 and the greenhouse gases may be the stronger element affecting the environment.
However, during this same period, global sea surface temp-
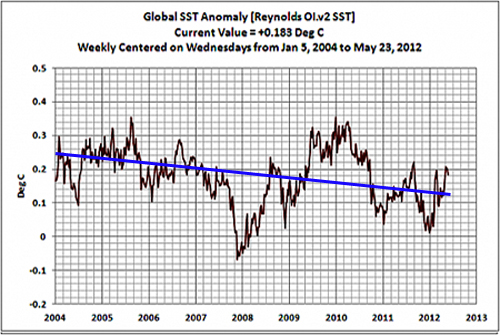 eratures (SSTs) were cooling somewhat See the Global SST chart to the left, also produced by NOAA (the same source as the Global Ocean 'Heat Content' chart above).
So there seems to be a conflict - surface waters were cooling while the deeper waters were heating. Can this be true? Yes, just like the upper atmospheric winds and surface winds can be different, so can the deep water current temperatures differ from the surface currents. Note that it takes many years for the oceans to distribute the heat absorbed from prior years. We are dealing with a complex of varying water temperature factors. Therefore, one has to be extremely careful not to "select" one segment of data from a very complex phenomenon and draw false conclusions.
The mathematical models are not perfect and neither is our understanding of the atmosphere, clouds, oceans and climate implications. In fact, the above GISS analysis lowered the estimate of the earth's rate of heating from 86 to 58 w/m2 - a 33% reduction. This was due to more cooling from fine particles (aerosols) in the atmosphere than previously estimated. These fine particles, mainly man made soot and other small particles, tend to help form clouds which have a net cooling affect. The climate effect from clouds is not thoroughly understood and is not modeled extensively by current climate forecasting models. In addition, ocean currents, such as the El Niño Southern Oscillation, (ENSO) can contribute significantly to global climate changes. Top
Oxygen In Our Oceans Is Starting To Run Low
Oxygen is an essential necessity of life on land. The same applies for almost all organisms in the ocean. However, the oxygen supply in the oceans is threatened by global warming in two ways: Warmer surface waters take up less oxygen than colder waters. In addition, warmer water stabilizes the stratification of the ocean, weakening the circulation connecting the surface with the deep ocean and less oxygen is transported into the deep sea.
The first global evaluation of millions of oxygen measurements confirms this trend. Researchers published their results in Global Biogeochemical Cycles in May, 2016.
For each degree of ocean warming, oxygen concentration goes down by 2 percent. Over the short term, the higher temperatures slow the rate of ocean circulation, exacerbating regional oxygen depletion. The rising temperatures cause layers of ocean water to stratify so the more oxygen-rich surface waters are less able to mix with oxygen-poor waters from the deeper ocean. At the same time, the higher temperatures are putting more stress on marine species, causing their metabolisms to speed up and their need for oxygen to increase. “So you have effects squeezing them on both sides,” said Curtis Deutsch, associate professor at the University of Washington’s School of Oceanography.
Deutsch’s latest research is untangling how much oxygen loss is linked to climate change and how much is due to normal variation in oxygen levels. “As the climate goes up, the amount of oxygen will go down, but it’s really hard to look in the ocean to see that change,” he said. Using an earth system modeling approach, Deutsch and scientists at the National Center for Atmospheric Research and the Georgia Institute of Technology mapped out changing oxygen levels across the world’s oceans through the end of the 21st century.
They found that it was possible to distinguish the impact of global warming from other sources of oxygen loss. As soon as 2030 to 2040, climate-driven declines in oxygen levels will be detectable in oceans all over the globe. In some places, like the southern Indian Ocean and parts of the eastern tropical Pacific and Atlantic basins, evidence of climate-linked deoxygenation is already apparent, while other regions won’t see changes by 2100.
“In some parts, you can actually detect a change relatively early, like right now. The signature of the climate being warmer is creating something that is unlike anything that is seen in history. Other places it is much harder to detect, either oxygen is decreasing slowly or there is so much natural variation. So basically the results depend on where you are,” Deutsch said. Top
What Exactly Is El Niño?
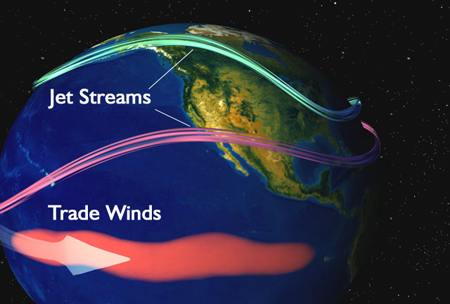
El Niño is a periodic climate pattern of the equatorial Pacific Ocean water that affects weather around the world. Its official name is the El Niño Southern Oscillation or ENSO for short. It is called an oscillation because of the cyclical reversing of surface air pressure between the eastern and western tropical Pacific. Normally the surface pressure is high in the eastern Pacific near Peru and low in the western Pacific near Indonesia. This causes the "trade winds" to flow from east to west - high pressure to low pressure.
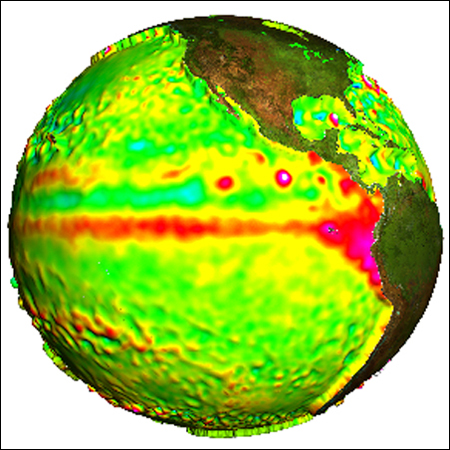
However, during an El Niño event this process reverses and there is low pressure on the eastern side next to Peru in South America and high pressure next to Indonesia in Asia. See the sea height map at the left. This cycle repeats itself between 2 and 5 years somewhat erratically. South American fisherman gave this phenomenon the name El Niño (which is Spanish for "little boy") because it occurs around Christmas, the birth of the Christ Child.
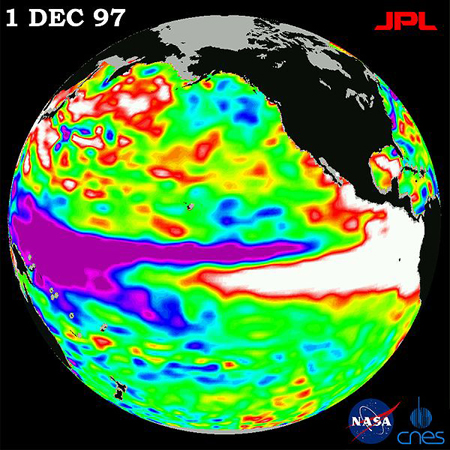
The image at the left below of the Pacific Ocean during a major El Niño event in December 1997 was produced using sea surface height measurements taken by satellite. In the white areas, the sea surface is between 14 and 32 centimeters (6 to 13 inches) above normal. In the red areas, it's about 10 centimeters (4 inches) above normal. The green areas are normal conditions. The purple area (Western Pacific) indicates at least 18 centimeters (7 inches) below normal sea level.
Although the effects of an El Niño are pretty well understood, the underlying causes of why the pressures reverse periodically are still under investigation. Using scientific Argo floats forecasters are now able to predict an El Niño 3 to 6 months in advance.
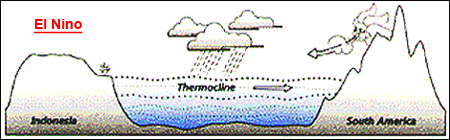
Shown at the left below are two sketches depicting typical conditions of the equatorial Pacific waters: the top one is "Normal Conditions", i.e. no El Niño, the bottom one represents "El Niño".
The water on the surface of the ocean is warmer than the bottom because it is heated by the sun. The "thermocline" layer of water is the area of transition between the warmer surface waters and the colder water at the bottom.
Normal (No El Niño). In normal times, the trade winds blow in a westerly direction and tend to also push the surface water toward the west. This makes the sea height in the western Pacific about half a meter (16 to 18 inches) higher than in the eastern.
In the eastern Pacific along the coast of South America, an up welling occurs (deep cold water from the bottom of the ocean moving up toward the surface). Off the shore of South America the water cools the air above it and the air becomes too heavy (a high-pressure system) to rise and produce rain clouds. This causes Peru and the surrounding areas to be relatively dry.
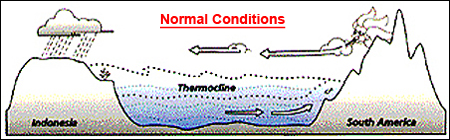
However, in the western Pacific, the air heated by the water below it, expands (a low-pressure system), rises and then cools shedding its moisture as monsoon storms typical in Indonesia and India.
The drier Indonesian air now heads east in the "upper atmosphere" way above the trade winds cooling more and increasing in density as it travels. By the time it reaches the west coast of the Americas, it is cold and heavy enough that it starts to sink, joining the high-pressure system near the water’s surface.
These lower air currents then turn around and again flow west as trade winds back toward Indonesia. Thus we have two huge systems making two very large elliptical circuits - the winds above and the water currents below with the trade winds and the surface currents jointly moving east to west.
El Niño. El Niño happens every few years when "weak" westerly trade winds (cause unknown) allow the warmer water from the western Pacific to flow eastward towards Peru. This levels the sea height, warms the surface water off the coast of South America, and increases the temperature of the deeper waters of the eastern Pacific. The atmosphere is also affected by the ocean changes. Tropical thunderstorms are fueled by hot, humid air over the oceans. The hotter the air, the stronger the thunderstorms. As the Pacific warm water heads eastward, big thunderstorms move with it. Mid-Pacific islands like Tahiti, which are normally tropical paradises, experience massive storms during an El Niño year.
With weak trade winds the top layer of the eastern Pacific ocean near South America does not move west. It stays in place, gets hotter and grows as it warms. Surface water evaporates into the lower layers of the atmosphere. Water vapor eventually rises into the upper atmosphere, condenses into storm clouds, and falls as torrential rain on the west coast of the Americas. The jet stream tends to stay farther north than usual over Canada such that less cold air migrates into the upper United States. California and the southwest tend to be much wetter than usual during the winter season. During the last 20 years, 7 El Niño events occurred in the years 1992, 1994, 1997, 2002, 2004, 2006 and 2009.
Very Strong El Niño. Less frequently, twice in the past 30 years (1982 and 1997), there have been very strong El Niño episodes where not only the east to west trade winds died, but the winds actually reversed themselves and flowed west to east as depicted in the chart at the left. All the effects listed above under a "standard" El Niño were exaggerated during 1997 (a record El Niño year) with severe consequences being felt all over the globe. The trade winds blew right across South America all the way to Africa. Countries on the east coast of South Africa experienced very severe droughts. The same was true of eastern Asia, especially India.
In the US Pacific Northwest, El Niño means a warmer, drier winter, a smaller snow pack, drying reservoirs, and more forest fires. Further south it brings pounding storms to the California coast and torrential rains across the Southwest and South. In 1997 the beach community of Malibu, CA lost its pier, a bridge, roads, and there was massive beach erosion. In the US alone, the 1997 El Niño did $2.6 billion of property damage and destroyed $2 billion worth of crops. The overall hit to the US economy was estimated to be $25 billion. However, there was one silver lining: the upper-level tropical winds flowing across the Atlantic blew the tops off forming cyclones reducing the number of hurricanes that struck land in the US by half that year.
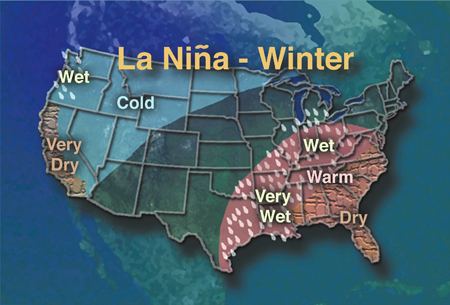
La Niña. Immediately following almost every El Niño is a La Niña event or events. La Niña (which means "little girl" in Spanish) is an abnormal cooling in the eastern Pacific close to South America which produces conditions just the opposite of those created by El Niño. The effects of La Niña are also most pronounced from December to March as shown in the US at the left.
During a La Niña year the easterly winds from the Americas are stronger than usual driving unusually large amounts of warm sea-surface water westward. This causes larger than normal volumes of deep, chilly water to rise to the surface in the east producing a cold region that extends 3,000 miles from Ecuador to Samoa. With much warm water flowing toward Asia, the western Pacific’s heat engine causes heavier than normal monsoon rains in India, higher than average precipitation in Australia, and wetter than normal conditions as far west as southern Africa. La Niña events occurred in the years 1995, 1996, 1998, 1999, 2007, 2008, 2010 and 2011. As can be seen from the yearly data, it is quite normal for La Nina's to repeat two years in a row after an El Niño. Top
The Great Ocean Conveyor Belt
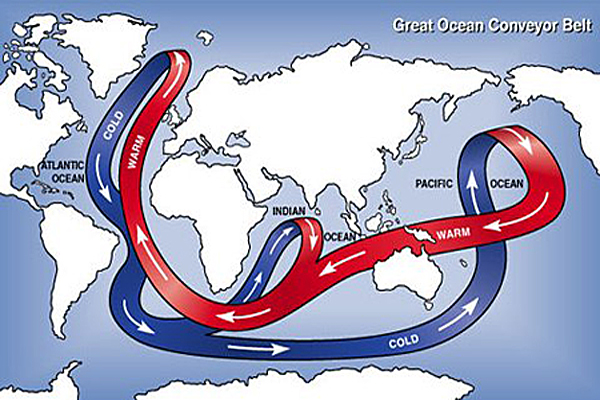
The sketch to the left is a "simplified" illustration of the Great Ocean Conveyor Belt. We begin the conveyor trip between Greenland and Iceland in the North Atlantic Sea. Cold, dry winds blowing across northern Canada chill the ocean surface waters. In addition, water evaporation, and sea ice formation all leave behind cold, salty dense water. (Salty water is denser than fresh water.) The cold, salty water sinks, overturns, and begins to flow southward. It flows south along the slopes of North and South America towards Antarctica.
As it bends around South Africa some currents branch off to the Indian Ocean while the rest continue east past Australia and up into the Pacific Ocean. These deep currents gradually warm and mix with upper level waters as they begin to flow northward.
After rising to the surface in the Northern Pacific, the surface waters bend around and flow southwest through the Indonesian islands into the Indian Ocean. Eventually they join up with the currents from the Indian Ocean and flow back around South Africa. After entering the Atlantic Ocean, the surface waters join up with the wind driven currents in the Atlantic becoming saltier from evaporation due to the intense tropical sun. The currents then become known as the Gulf Stream as they travel up the eastern coast of the US and back across the Atlantic to warm Northwestern Europe. As they flow further north back to Greenland they loose most of their heat. They become cold and very salty and begin their deep, overturning dive once again. This trip around the world is very, very slow, it takes approximately 1,000 years to make the round trip. For more detailed information on the Great Ocean Conveyor Belt click here. Top
Great Underwater Waves
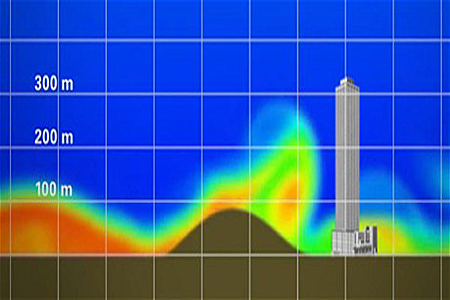
A 70-foot wave is a terrifying wall of water that only the best surfers can ride. But it's a midget compared with the huge waves that lurk under the ocean's surface. These underwater waves can rival skyscrapers in height, 800 feet high, and measure up to 500 miles wide and a mile between peaks. The waves can take an hour to break. See the illustration to the left. Underwater waves "are the lumbering giants of the ocean," says MIT oceanographer Thomas Peacock, who studies them. Such waves "roll around the planet... But we see only little glimpses of them, because we live our lives above the surface." Because these waves are hard to detect, it is a challenge to study them directly in the ocean.
Known as internal waves, they owe their existence to the structure of the ocean, which is layered like a cake. The upper layer, the water closest to the surface, is warmer and lighter, while the lower layers are colder and denser. Rather than being found in exotic locations, internal waves are found three miles beneath the surface of the ocean.
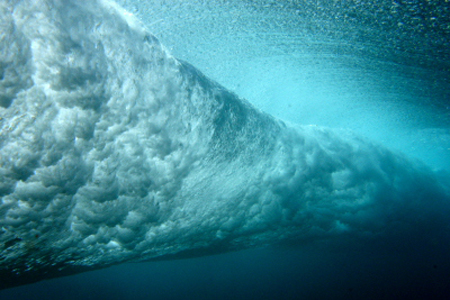
When a tide pushes the lower layers over a ridge on the sea floor, a huge wave is born at the transition from warmer to colder water. These deep waves are the same shape as their white capped cousins on the surface. See the photo to the left. Underwater waves only move about 6 miles per hour, but their leisurely pace conceals their immense power.
A cross-section of an internal wave resembles surface waves. The only difference between an underwater wave and the water around it is its density. Densities vary due to either temperature or salinity differences. These cause the ocean water to become stratified. Though invisible to the eye, the boundary between colder, saltier water below and warmer, less-salty water above can be detected by instruments. That boundary layer resembles the ocean’s surface, producing waves that reach towering heights and plays a key role in the mixing of ocean waters.
Large internal waves act like a gargantuan mixer churning together sea waters of different saltiness and temperature until they're thoroughly blended together. These internal waves are "absolutely key for understanding climate change," says oceanographer Mathew Alfred of the University of Washington.
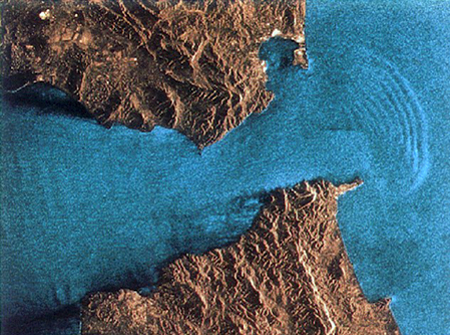
Among the new techniques that have helped to propel the field forward is the use of satellite data. While the submerged waves might raise the surface of the water by less than an inch, satellite data can clearly discern the difference. See the photo at the left of underwater waves off the Strait Of Gibraltar taken by satellite.
"Internal waves influence ocean turbulence, which in turn affects the grand network of ocean currents that carries heat around the globe" says Thomas Peacock of MIT. "It is an important missing piece in climate modeling. Right now global climate models are not able to capture these processes, but it is clearly important to do so. You get a different answer if you don't account for these waves."
To incorporate the new findings into climate models, oceanographers are meeting with modeling teams as part of an effort to improve climate modeling sponsored by the National Science Foundation .
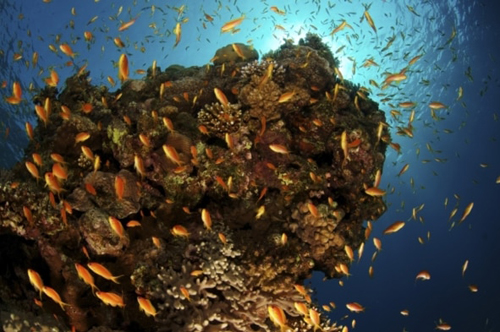
Beyond their effects on climate, internal waves play a significant role in sustaining coral-reef ecosystems which are considered vulnerable to climate change and to other environmental effects. Internal waves bring nutrients up from the ocean depths which then bathe the coral-reefs.
Top